

The figure below [1] shows that the renewable energy transition in the U.S. now relies on a three part portfolio of natural gas, solar and wind power capacity additions, to meet new power generation capacity needs and to fill supply gaps resulting from coal fired power plant retirements.
Annual US Electricity Generation Capacity Additions - 2011 - 2020

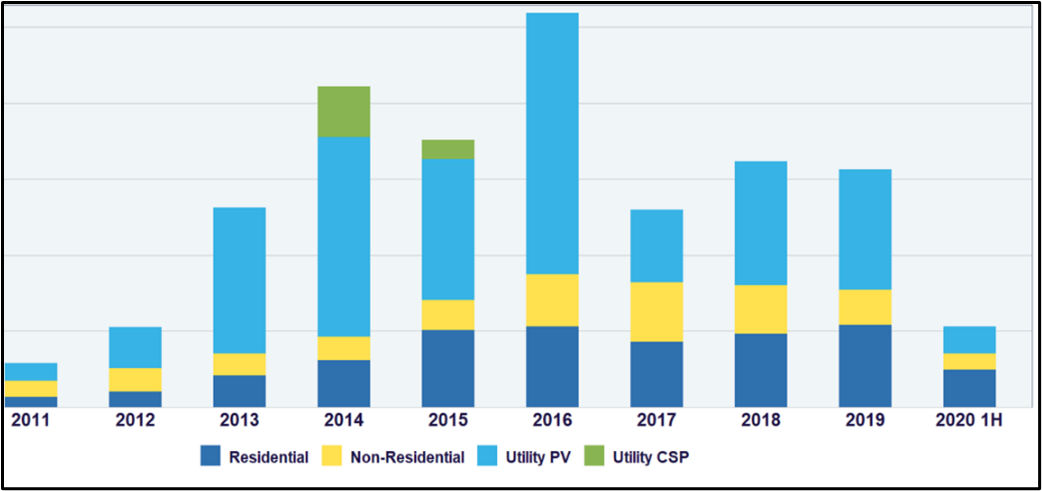
Annual Solar Capacity Additions - California - 2011 - 2020
The second figure [2] shows the trajectory of the solar share of California’s electricity supply portfolio. “Utility solar” plants feeding electricity into high voltage transmission systems account for roughly 50 percent of capacity additions over the past decade, while deployment on residential and non-residential (mostly commercial) property accounts for the other half.
[1] https://www.seia.org/research-resources/solar-market-insight-report-2020-q3
[2] Ibid.